The Event Availability report displays counts and values for open, held, sold, unpaid and complimentary seats by price zone for selected events within a given series. Seats sold with a zero net value are considered complimentary. Values for open, held and total capacity are projected and calculated using the price set on the event pricing model.
If there is no default price model, the 'Projected Value' will be calculated as the total 'Paid' plus the total 'Unpaid'. If the pricing from the price chart includes taxes, then taxes are included in this report's projected values. You can filter the events included in this report by event code or date.
This report can provide you with useful information on year-to-date sales for events as part of the daily sales report processing. You can also use this report to provide show producers and executive members with sales and held ticket information.
Criteria
The following table describes this report’s criteria:
Criteria |
Description |
Venue |
Filters the report by one or more venue selections. Click |
Series |
Filters the report by the 'Series Name' defined on the Event Configuration - Events|Basic page. |
Events From |
Filters for those events that occur on or after the date entered. The application will ignore your entry if you do not enter a value for 'Events To' date. Click |
Events To |
Filters for those events that occur on or before the date entered. The application will ignore your entry if you do not enter a value for 'Events From' date. Click |
Event Code |
Filters the report by a specific event. Click |
Report on Opens or Holds |
Filters the report by: •Open Seats and Holds: ▪If no options are selected from the 'Hold Types' field, open seats and all holds will be returned within the reports results. ▪If options are selected from the 'Hold Types' field and Exclude Holds is selected from the 'Include or Exclude Selected Holds' dropdown, open seats and all holds except the selected holds will be returned within the report's results. ▪If options are selected from the 'Hold Types' field and Include Holds is selected from the 'Include or Exclude Selected Holds' dropdown, open seats and only the selected holds will be returned within the report's results. •Open Seats Only: Regardless of the option selected from the 'Include or Exclude Selected Holds' dropdown, or the options selected from the 'Hold Types' field, only open seats will be returned within the report's results. •Holds Only: ▪If no options are selected from the 'Hold Types' field, all of the holds (and only holds) will be returned within the report's results. ▪If options are selected from the 'Hold Types' field and Exclude Holds is selected from the 'Include or Exclude Selected Holds' dropdown, all holds except the selected holds will be returned within the report's results. ▪If options are selected from the 'Hold Types' field and Include Holds is selected from the 'Include or Exclude Selected Holds' dropdown, only the selected holds will be returned within the report's results. |
Include or Exclude Selected Holds |
Choose whether or not to include the holds selected from the 'Hold Type' field in the report's results: •Exclude Selected Holds: Excludes all of the options selected from the 'Hold Type' field from the report's results. •Include Selected Holds: Includes only the options selected from the 'Hold Type' field from the report's results. |
Hold Type |
Filters the report by the selected hold type(s). |
Report Output By |
Displays totals by: •Performance (Event) •Performance Short Description (Event Name) •Price Zone •Series |


Output
The following image illustrates a sample report.
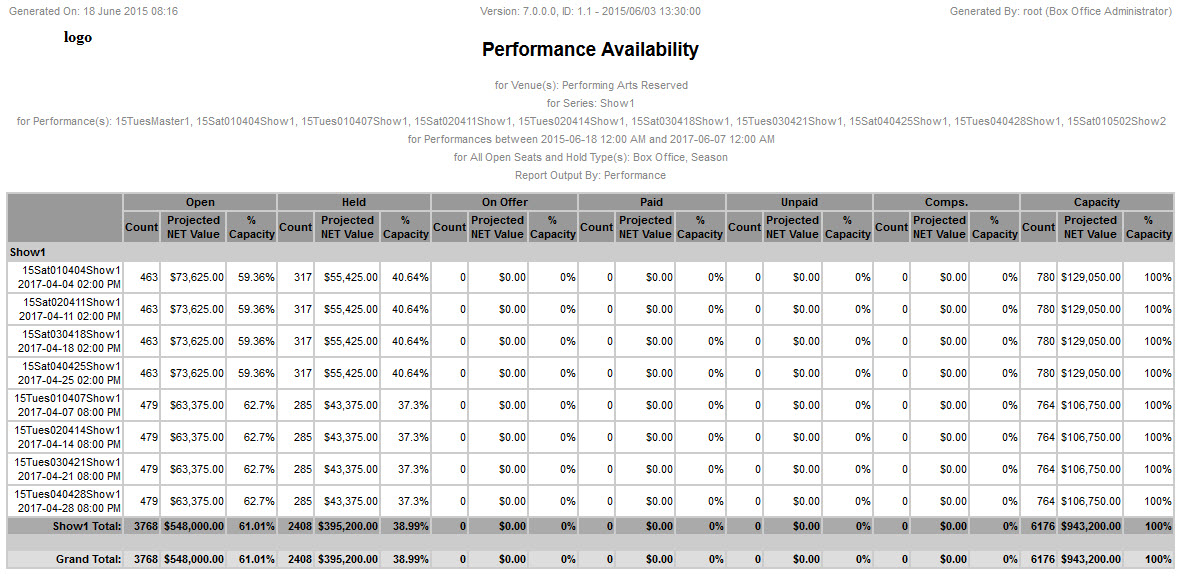
The following table describes the report’s output:
Column |
Description |
Open |
The total number of unsold seats and the projected value of those seats. Projected values are calculated using the highest price from the event’s default pricing model. If there is no default price model, the 'Projected Value' will be calculated as the total 'Paid' plus the total 'Unpaid'. If the pricing from the price chart includes taxes, then taxes are included in this report's projected values. |
Held |
The total number of seats on hold and the projected value of those seats. Projected values are calculated using the highest price from the event’s default pricing model .If there is no default price model, the 'Projected Value' will be calculated as the total 'Paid' plus the total 'Unpaid'. If the pricing from the price chart includes taxes, then taxes are included in this report's projected values. |
On Offer |
The total number of seats that are currently on offer and the projected value of those seats. Projected values are calculated using the highest price from the event’s default pricing model. If there is no default price model, the 'Projected Value' will be calculated as the total 'Paid' plus the total 'Unpaid'. If the pricing from the price chart includes taxes, then taxes are included in this report's projected values. |
Paid |
The total number of seats purchased and fully allocated, and the net value of those seats (excluding taxes and service charges). |
Unpaid |
The total number of sold seats with an outstanding balance and the net value of those seats (excluding taxes and service charges and any partial payments). |
Comps. |
The total number of complimentary seats sold. Complimentary seats are those seats sold with a zero total value. |
Capacity |
The total seat count of the event or series and the total projected value of the event based on a sum of open, held, paid, unpaid, and complimentary seats (does not include seats removed from inventory). Projected values are calculated using the highest price from the event’s default pricing model.If there is no default price model, the 'Projected Value' will be calculated as the total 'Paid' plus the total 'Unpaid'. If the pricing from the price chart includes taxes, then taxes are included in this report's projected values. |
Total |
A sum of the values in the report. |
% Capacity |
The percentage of seats open, held, paid, unpaid and complimentary (calculated against the total capacity). |
Projected Net Value |
Projected values are calculated using the highest price from the event’s default pricing model. If there is no default price model, the 'Projected Value' will be calculated as the total 'Paid' plus the total 'Unpaid'. |
|
Information Seats sold at zero value ($0.00) are shown in the 'Comps' column, but are not included in the 'Paid' or 'Unpaid' columns. |

|
Information If a seat with a hold is sold, and the hold is still on the seat, the seat will appear in either the 'Paid' or 'Unpaid' columns, depending on its paid status. It will no longer appear in the 'Held' column. |