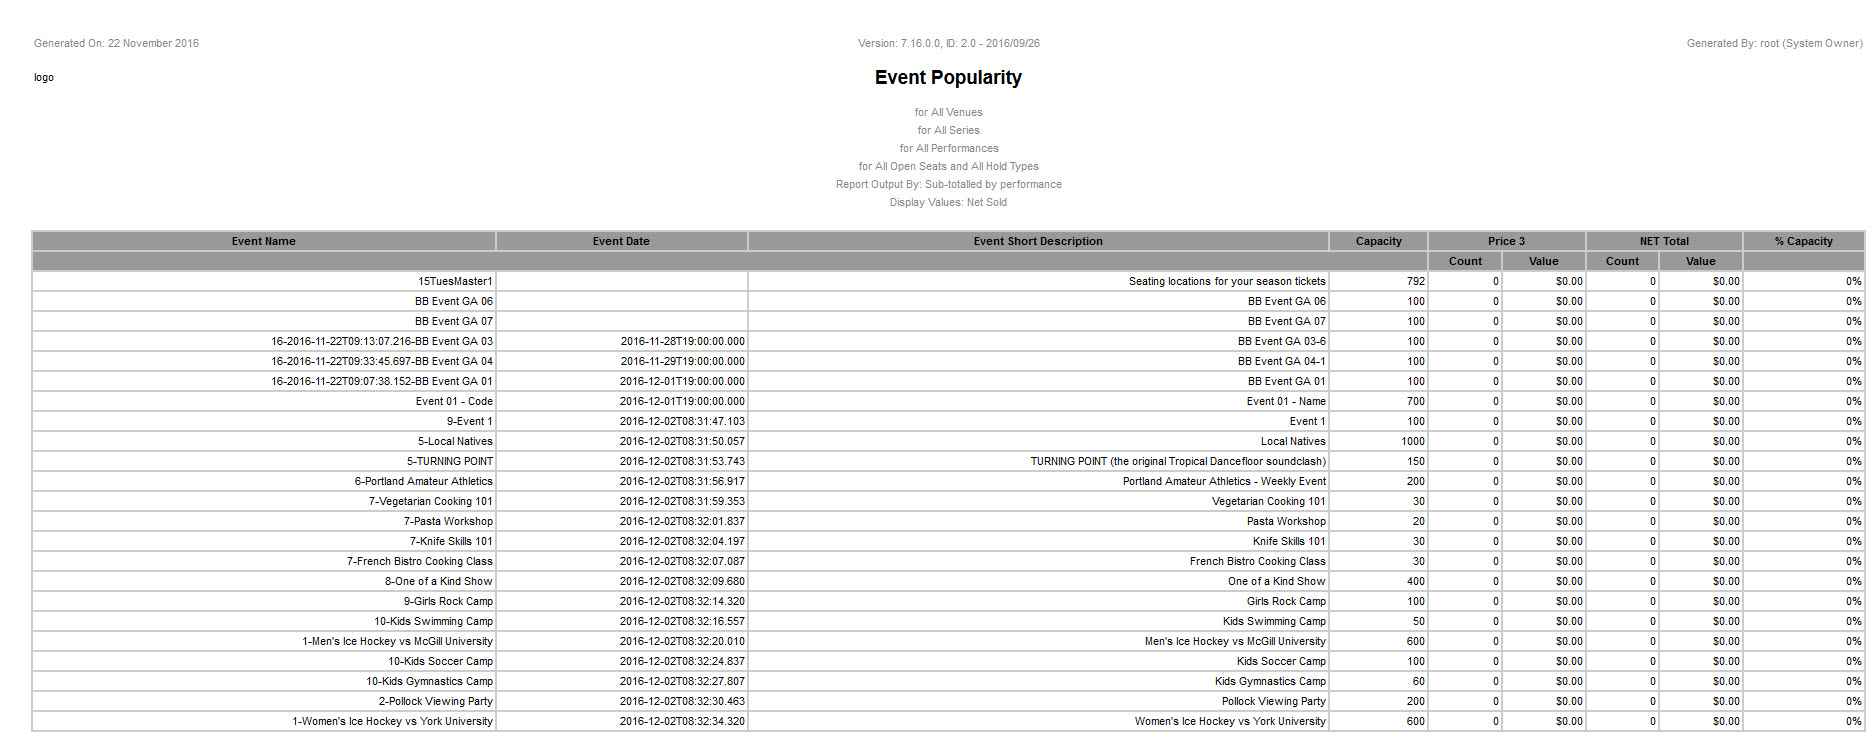
The Event Popularity report displays the admissions sold (allocated and unallocated), the net value of sold admissions (excluding taxes and service charges), and the percentage of the total capacity sold for a selected series. You can further filter this report by event, event date range, and/or venue.
The report is itemized by event and sub-totalled by price zone. If your organization uses the event 'Short Description' to group events, you can also sub-total the report by event 'Short Description'.
|
Information If you are using the Full payment allocation strategy, payments will be allocated once there is no balance due on an order. Unallocated payments are payments that have been received but have left a balance or have overpaid an order. For more information, refer to Configuring the Allocation Strategy. |
Since this report offers an instant view of event sales, you can use this report on demand to determine how particular events are selling. This report gives a sense of show revenue and popularity which can assist in marketing.
Criteria
The following table describes this report’s criteria:
Criteria |
Description |
||
Venue |
Filters the report by one or more venue selections. Click |
||
Series |
Filters the report by the 'Series Name' defined on the Event Configuration - Events|Basic page. |
||
Events From |
Filters for those events that occur on or after the date entered. Your entry will be ignored if you do not enter a value for 'Events To' date. Click |
||
Events To |
Filters for those events that occur on or before the date entered. Your entry will be ignored if you do not enter a value for 'Events From' date. Click |
||
Event Code |
Filters the report by a specific event. Click |
||
Report Output By |
Displays totals by: •Sub-totalled by Event •Sub-totalled by Event Short Description: Provides sub-totals for events with the same event short description |
||
Display Values |
Filters the report by the values that you want to display: •Net Paid: The net value of the tickets that have been paid for. •Net Sold: The net value of the tickets that are on an order, but have not been paid for (the customer will pay for the ticket when he/she picks it up at will call). |
||
Include Open Holds |
Choose whether or not to include open holds in the report. Open holds are tickets that are not on hold: •Blank: Leaving the field blank will return all sold tickets. •Always: Filters for all sold tickets that were not on a hold. •Never: Filters for all sold tickets that were on a hold. |
||
Hold Type |
Filters the report by the selected hold type(s).
|
Output
The following image illustrates the report's output:

The following table describes the report’s output:
Column |
Description |
Event Name |
The event code. |
Event Date |
The date and time of the event. |
Event Description |
The description of the event. If you chose to output the report by event description, each event with the same description are grouped together and subtotals provided for each unique group. |
Capacity |
The seating capacity of the event. |
Price Zone |
For each price zone, the number of seats sold and value of the admission (excluding taxes and service charges). These numbers represent allocated and unallocated admissions. |
NET Total |
The total number of seats sold and net value of the admissions (excluding taxes and service charges). These numbers represent allocated and unallocated admissions. |
% Capacity |
The percentage of total capacity sold. |

